Jobs
How will AVs Impact Access to Job Opportunities?
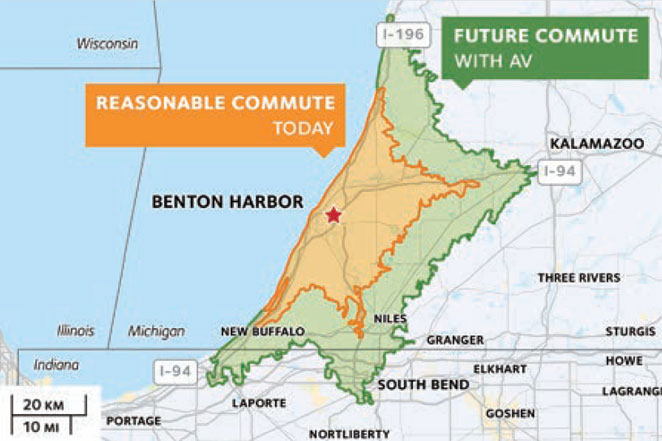
Benton Harbor, MI
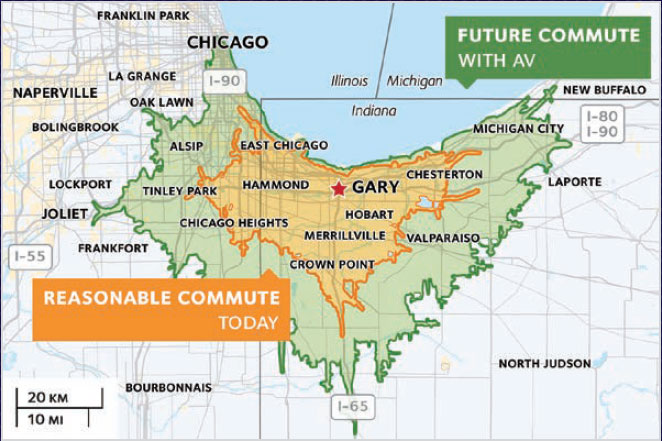
Gary, IN
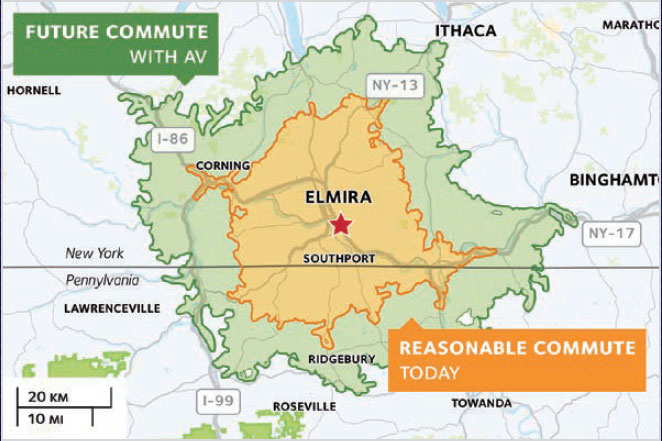
Elmira, NY
Wilmington, DE
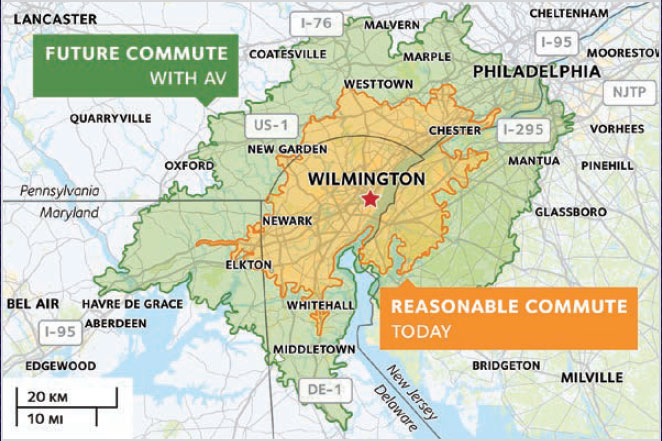
Note: Orange represents area commutable in 30 minutes during peak hours today. Green simulates AV travel by representing area reachable today in 40 minutes of travel during off-peak hours. Analysis used Alteryx Analytics and TomTom Traffic dataset; visualized with OpenStreetMaps.
Source: SAFE analysis based on framework from David Montgomery, Public and Private Benefits of Autonomous Vehicles, March 2018.
Time and Productivity Savings from Autonomous Vehicles
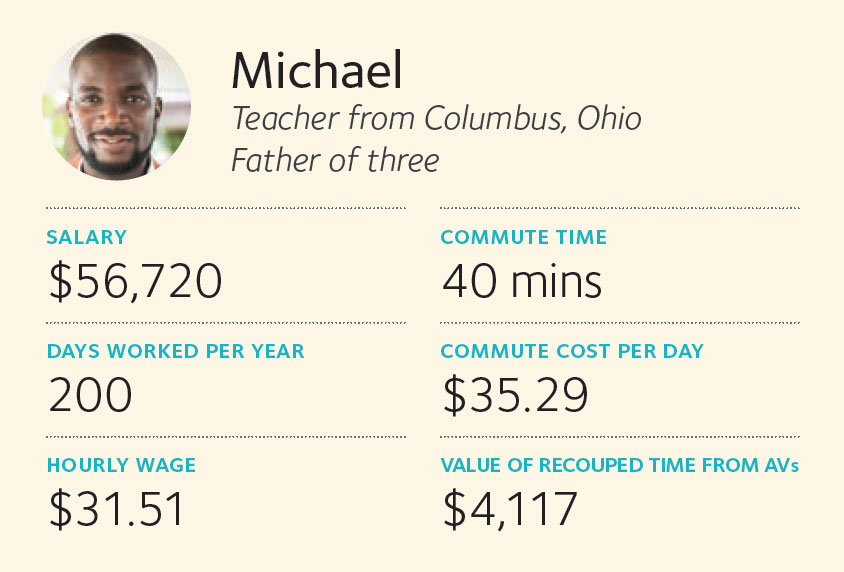
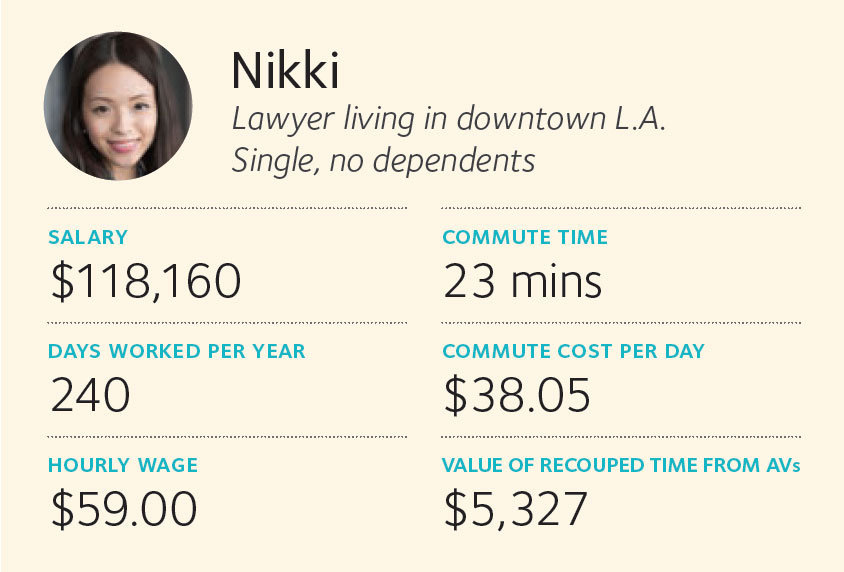
Note: Calculation assumes that the cost of travel time for an urban commuting driver is 84 percent of an hourly wage and that the cost of time for a commuting passenger in light traffic is 35 percent of hourly wage. Salaries are national median for occupation.
Source: SAFE analysis based on data from Bureau of Labor Statistics and Victoria Transport Policy Institute, Transportation Cost and Benefit Analysis II – Travel Time Costs, April 24, 2018.
AV technology will transform possibilities, expanding reasonable commuting distances, and with it, the labor market size for a given area.


